Monitoring Data Quality with Amazon Deequ
Data quality is a quite broad topic that consists of different components, including schema validation, data cleaning, data profiling, unit testing, and monitoring.
In the article, I will explain how Amazon Deequ could be used for monitoring data quality with examples. You will learn how to:
About Amazon Deequ
According to information from Amazon Deequ developers, Deequ is a library built on top of Apache Spark for defining “unit tests for data”. It measures data quality in large datasets. The entire project can be found here.
We can use Deequ to calculate various metrics (such as CountDistinct, Distinctness, Maximum, Mean, Min, Uniqueness, and others) against datasets. All calculations are performed on top of Apache Spark, which makes the library highly efficient and scalable.
Environment Setup
To follow this tutorial, you will need:
- Apache Spark versions 2.2.x to 2.4.x and 3.0.x.
- Docker
- Scala/Java
First, set up and connect to InfluxDB by running the following commands in a console:
# pull influxDB docker image
docker pull influxdb:1.8.4# run docker container
docker run — rm — name=influxdb -d -p 8086:8086 influxdb:1.8.4# connect to docker container and run influxDB console
docker exec -it influxdb influx# create database which we will use for storing our metrics
create database example
Then, install Grafana (in a different console):
# pull grafana docker image
docker pull grafana/grafana# run Grafana docker container & connect it with influxDB container
docker run -d — rm — name=grafana -p 3000:3000 — link influxdb grafana/grafana
Now you can clone this repository from GitHub and open it in your favorite IDE.
Generate Data Quality Metrics
The InfluxDBMetricRepository object contains the main logic for loading input data, calculating data quality metrics, and writing results to InfluxDB.
The Metric Repository is an interface I created to allow the saving of Deequ’s computation results to different systems/formats. Out of the box, the library offers the capability to save results as a DataFrame or to the file system as JSON or in memory. You can extend this interface and add implementations for different systems/formats. In this tutorial, we will use this interface to save our results to InfluxDB.
Execute the InfluxDBMetricRepository object, and then run the following commands in the InfluxDB console to check the results:
use example
select * from InfluxDBMetricsRepository
You should see the output as below:

If you run this example several times against the same data, you will find results for each execution. In InfluxDB, you can define the retention period (how long the data should be stored).
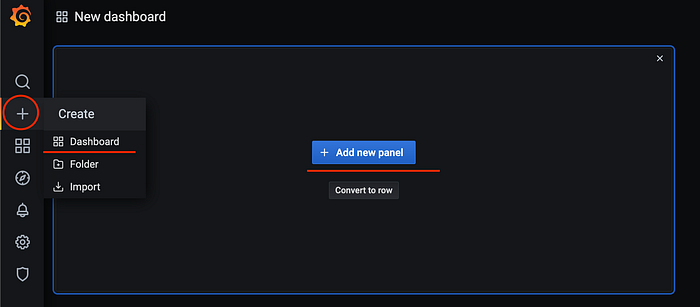
Visualization in Grafana
Now it’s time to create a dashboard in Grafana. Open this link in your browser: http://localhost:3000/ (the default username/password is admin/admin).
Let’s create a new Data Source for our InfluxDB. Go to Configuration — > Data Sources — > Add Data Source and enter the following configurations:
Name: InfluxDB
URL: http://influxdb:8086
Database: example
User: admin
Password: admin
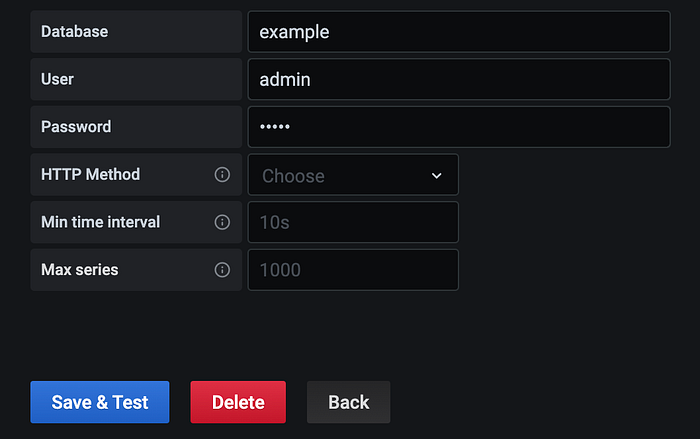
Press Save & Test .
Then define query parameters:
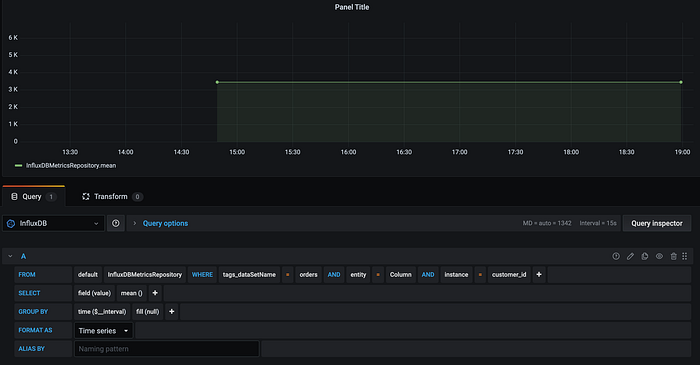
You can adjust other dashboard parameters to achieve the necessary results.
Conclusion
You can use Amazon Deequ not only as a library for unit testing but also for data quality monitoring. In this example, I created the MetricRepository as a connector from Deequ to InfluxDB, but you can create your own or use the FileSystemMetricRepository from Amazon (which will require you to process input files with a tool of your choice). Of course, you can build and visualize derived metrics and even send notifications to data stewards.
